
Rio de Janeiro Crime Statistics 2026: What the Data Says
Written and reviewed by Lotte — Rio local, founder & editor of PlanRio · How we research · First published · Last reviewed
Centro has shown the sharpest growth in phone robbery of any part of the city, even as overall street robbery falls.
Quick answer
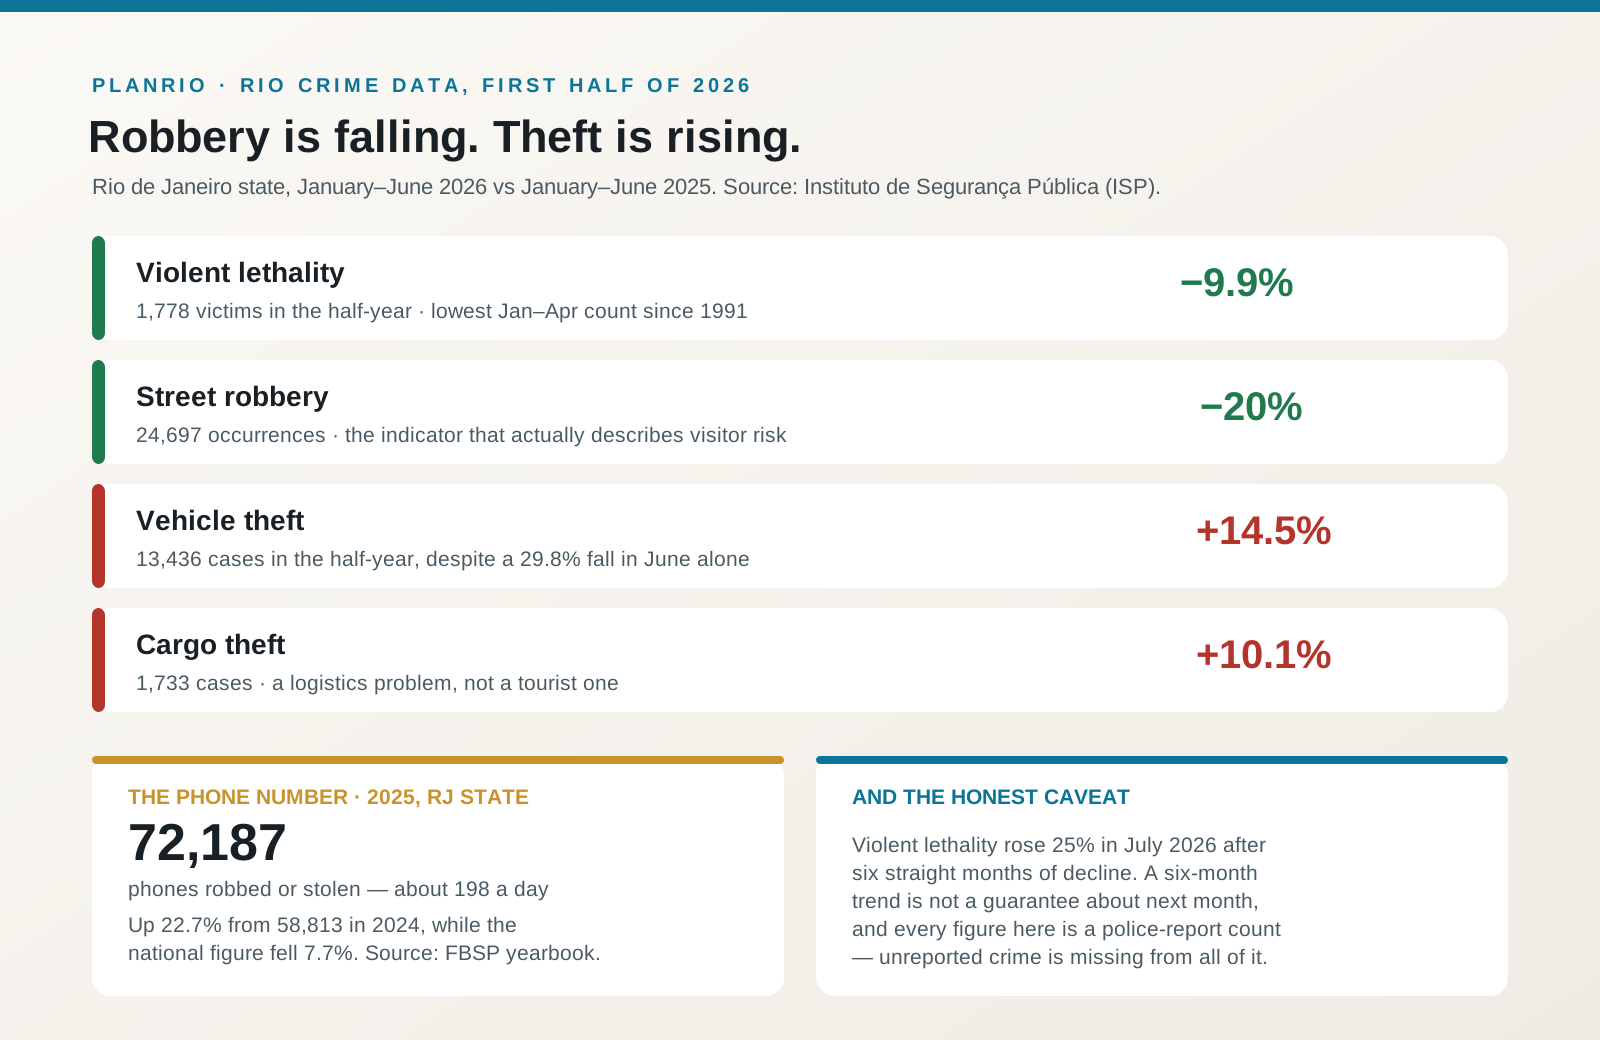
Rio's two crime trends point opposite ways. ISP recorded 1,778 violent deaths in Rio state in the first half of 2026, down 9.9% and the lowest January–April count since 1991, and street robbery fell 20%. But 72,187 phones were robbed or stolen in 2025, up 22.7% while Brazil fell 7.7%.
Open ISP's official Rio de Janeiro crime datasetsAt a glance
Who publishes the data
ISP (Instituto de Segurança Pública), the Rio state body that compiles police-report counts monthly.
Violent deaths, H1 2026
1,778 in Rio state — down 9.9% year on year; the January–April count was the lowest since 1991.
Street robbery, H1 2026
24,697 occurrences — down 20% year on year.
Going the other way
Vehicle theft +14.5% and cargo theft +10.1% across the same half-year.
The traveller number
72,187 phones robbed or stolen in Rio state in 2025 — about 198 a day, up 22.7% while Brazil fell 7.7%.
What it is not
Not a live feed and not a forecast. July 2026 lethality rose 25% after six falling months.
The two trends everyone reports as one
Rio's crime data in 2026 is not a single story and anyone telling you “Rio is getting safer” or “Rio is getting worse” is quoting half of it. Violence against people is falling hard: the Instituto de Segurança Pública recorded 1,778 violent deaths in Rio de Janeiro state in the first half of 2026, down 9.9% on the same period of 2025, and the January-to-April count of 1,242 was the lowest for those months since 1991. Street robbery fell 20% over the same half-year, to 24,697 recorded occurrences.
Theft of property, meanwhile, went up. Vehicle theft rose 14.5% across the half-year to 13,436 cases and cargo theft rose 10.1% to 1,733, even though both fell sharply in June alone. And the single indicator that describes most visitor experience — phones — has been rising for years: the Brazilian Public Security Yearbook recorded 72,187 mobile phones robbed or stolen in Rio state during 2025, up 22.7% from 58,813 in 2024, at a time when the national figure fell 7.7%. Rio was one of only two states in Brazil where that number grew.
If you want one sentence: the chance of being hurt in Rio is falling, and the chance of losing your phone is not. That is a very different risk profile from the one the headlines imply, and it changes what you should actually do differently on the ground.
Violent death: the falling number that barely touches your trip
“Letalidade violenta” is ISP's umbrella indicator: intentional homicide, robbery followed by death, bodily harm followed by death, and deaths resulting from police intervention. It is the number international coverage of Rio is built on, and it is genuinely improving — the first four months of 2026 produced the lowest count in 35 years of the series.
It is also the number least relevant to a visitor, because of where it happens. Violent death in Rio is concentrated in specific territories contested by armed groups, almost all of them far from the Zona Sul, Centro's daytime core, Barra or the airport corridor. A tourist in Ipanema is not statistically exposed to the thing that drives this indicator, in the same way that a tourist in central Chicago is not exposed to that city's homicide geography.
The honest counterweight: a six-month trend is not a promise about next month. In July 2026, violent lethality jumped 25% after six consecutive months of decline. Police operations, disputes between armed groups and single incidents move this number abruptly, which is exactly why we treat our same-day safety page as a planning-context page and not a forecast.
Street robbery: down 20%, and still the number that matters
“Roubo de rua” is ISP's composite of robbery against pedestrians, robbery on public transport and robbery of mobile phones. It is the closest thing in the official data to “what might happen to a visitor”, and it fell 20% across the first half of 2026 to 24,697 recorded occurrences — 3,820 in June alone, down 21.9% on June 2025.
That is real improvement and it is worth saying plainly, because the number has been falling steadily enough that advice written in 2022 now overstates the risk. The municipal patrol programme publishes its own perimeter-level figures showing the steepest falls in parts of Botafogo, Centro, Tijuca and Campo Grande — the stretches with the densest targeted patrolling.
Where it has not improved is composition. Phone robbery now accounts for close to 38% of all street robbery in recent ISP reporting, and Centro has seen the sharpest growth of any part of the city — in one January-to-August comparison, over 1,300 phone robberies against roughly 610 the year before. So street robbery is less likely than it was, and more likely than ever to be specifically about the thing in your hand.
Four words you have to separate: roubo, furto, letalidade, registro
Brazilian crime data distinguishes roubo from furto, and English-language coverage collapses them constantly. Roubo is taking by force or threat — a snatch, a mugging, a weapon. Furto is taking without violence — a phone lifted off a café table, a bag out of an unattended car. They are separate legal categories with separate statistics, and the two move independently: Rio's roubo numbers are falling while furto numbers rise. If a figure does not say which one it is, you cannot use it.
Letalidade violenta, as above, is a bundle of four causes of death and not a homicide rate. Comparing it to another country's homicide rate overstates Rio by including police-intervention deaths and robbery-related deaths.
And every figure on this page is a registro count — a tally of police reports actually filed. Stolen phones are massively under-reported by visitors, who leave the country rather than spend a morning at a delegacia, so the true number is higher than 72,187 and the true improvement in street robbery is less certain than the percentage suggests. A falling count can mean falling crime, falling reporting, or both.
Five rules for reading any Rio crime number
First, check whether it is the state or the city. ISP publishes Rio de Janeiro state, which includes Baixada Fluminense municipalities with very different risk profiles from the city, and journalists switch between the two mid-article. A state figure tells you almost nothing about Leblon.
Second, check the denominator. An absolute count rising in a metropolitan region of twelve million is not the same as a rate rising, and most of the figures quoted in travel coverage are raw counts with no population base at all.
Third, check the comparison period. Month-on-month in Rio is noise: a single operation, a holiday weekend or a heatwave moves it. Year-on-year for the same months is the minimum honest comparison, and a rolling twelve months is better.
Fourth, check which indicator. “Crime is up in Rio” is usually true of some indicator in some month — there are dozens. Ask which one, then ask whether it has any mechanism that could reach a visitor. Cargo theft rising 10% is a logistics story, not a holiday story.
Fifth, separate data from geography. Rio's risk is more spatial than it is temporal: which street, which hour, which direction you walk out of the metro matters more than which quarter the data covers. That is what our neighbourhood-level safety map is for, and no citywide statistic substitutes for it.
What the data actually implies for your trip
Treat the phone as the asset at risk and plan around it specifically — that is what the numbers say, and it is a much narrower, more solvable problem than “Rio is dangerous”. Our same-day safety check covers the official sources to read before you go out, and the neighbourhood safety map covers 45 areas by day and night, which is the resolution these statistics cannot give you.
Second, buy travel insurance that actually covers electronics theft, and read the clause on unattended items and police reports — most policies require a boletim de ocorrência filed in Brazil, which means you need to know where the tourist police station is before you need it. We cover what to do in the first hour in robbed in Rio: what to do, and the policy comparison in our Rio travel insurance guide.
Third, don't let the improving numbers talk you out of basic habits. A 20% fall in street robbery still leaves nearly 25,000 recorded robberies in six months. The point of reading the data is not reassurance — it is working out which of the many things you have been told to worry about are the two that are actually load-bearing.
The one purchase the data actually justifies
If 198 phones a day are taken across the state and visitor theft is under-reported, the practical response is cover that pays out on electronics — and a policy you have read the unattended-items clause of.
Links may earn us a commission at no extra cost to you. This supports PlanRio.
Common mistakes tourists make
- Quoting a Rio de Janeiro state figure as if it described Ipanema. The state includes municipalities with completely different risk profiles.
- Reading letalidade violenta as a homicide rate. It bundles homicide with robbery-related deaths and deaths from police intervention.
- Treating roubo and furto as the same thing. One is taken by force, the other is not, and in Rio they are currently moving in opposite directions.
- Comparing one month to the previous month. Rio's monthly numbers are noise; year-on-year for the same months is the minimum.
- Assuming a falling count means falling crime. These are police-report counts, and visitor phone theft is heavily under-reported.
- Using a citywide statistic to decide whether to walk down a particular street at night. Rio's risk is spatial; the data is not.
- Letting the improving numbers replace basic habits — nearly 25,000 street robberies were still recorded in six months.
Local expert tips
- Read ISP's own monthly data rather than coverage of it: ispdados.rj.gov.br publishes the indicator series and the open datasets.
- When a figure is quoted at you, ask three questions — state or city, which indicator, and compared with what period.
- Watch the composition, not just the total. Street robbery falling while phone robbery grows as a share of it is the actual 2026 story.
- Budget for the phone, not for the worst case: an anti-theft habit and insurance that covers electronics address the realistic risk.
- If something does happen, file a boletim de ocorrência. It is what your insurer needs, and it is why the official counts are too low.
- Treat the monthly swings as weather, not climate — one month's 25% rise does not mean the multi-year trend reversed.
Frequently asked questions
What is the crime rate in Rio de Janeiro in 2026?+
Rio de Janeiro state recorded 1,778 violent deaths in the first half of 2026, down 9.9% year on year, with the January–April count the lowest since 1991. Street robbery fell 20% to 24,697 recorded occurrences. Vehicle theft rose 14.5% and cargo theft 10.1% over the same period. All figures come from ISP, the state public-security institute, and count filed police reports.
Is crime in Rio going up or down?+
Both, depending on the crime. Violence against people — homicide and street robbery — is falling clearly in 2026. Property theft is rising: vehicle theft, cargo theft and above all mobile phones, with 72,187 phones robbed or stolen in Rio state in 2025, up 22.7% while Brazil as a whole fell 7.7%. Any single-direction claim about Rio crime is quoting one indicator.
Where can I find official Rio crime statistics?+
ISP, the Instituto de Segurança Pública of Rio de Janeiro state, publishes monthly indicator data and open datasets at ispdados.rj.gov.br, built from occurrence reports filed at police stations. National comparisons come from the Fórum Brasileiro de Segurança Pública's annual yearbook. Both are free, and both are Portuguese-language sources.
What is the difference between roubo and furto in Brazilian crime data?+
Roubo is taking by force or threat — a mugging, a snatch, a weapon shown. Furto is taking without violence — a phone lifted from a table, a bag from an unlocked car. They are separate legal categories with separate statistics that move independently, and in Rio right now roubo is falling while furto rises. A figure that does not specify which cannot be interpreted.
How many phones are stolen in Rio?+
About 198 a day across Rio de Janeiro state: 72,187 mobile phones were robbed or stolen in 2025 according to the Brazilian Public Security Yearbook, up 22.7% on the 58,813 recorded in 2024. Phone robbery accounts for close to 38% of all street robbery in recent ISP reporting, and the real total is higher because many visitors never file a report.
Does the data mean tourist areas in Rio are safe?+
The data cannot answer that, because it is published for the state and the city rather than for streets. What it shows is that the indicator driving Rio's reputation — violent death — is concentrated in territories contested by armed groups, far from the Zona Sul, Barra and the daytime Centro. For street-level judgement you need a neighbourhood resource, not a citywide statistic.
Why did violent deaths in Rio rise in July 2026?+
ISP recorded a 25% increase in violent lethality in July 2026 after six consecutive months of decline. Monthly figures in Rio are volatile because single police operations and disputes between armed groups move them sharply, which is why a six-month trend should never be read as a guarantee about the month you are travelling in.
Is Rio more dangerous than other big cities?+
On violent death, Rio's rate is higher than any major US or European city, and that comparison is routinely made unfairly: ISP's letalidade violenta bundles homicide with robbery-related and police-intervention deaths, so it is not a like-for-like homicide rate. On the risk a visitor actually faces — street robbery and phone theft — Rio is comparable to other large Latin American capitals and worse than most European ones.
Should I report a theft to the police in Rio?+
Yes, if you want to claim on insurance — most policies require a boletim de ocorrência filed in Brazil. Reporting also feeds the statistics on this page, which is why the official counts understate what happens to visitors. You can file at a DEAT tourist police station or online for some property offences.
Sources and image credit
Details and access can change. Use these venue, operator and public-information sources to recheck key details before visiting.
- ISP: official Rio de Janeiro state security datasets ↗
The primary source. Monthly indicator series and open data built from filed occurrence reports.
- ISP H1 2026: street robbery and violent lethality figures ↗
June and half-year counts for lethality, street robbery, vehicle theft and cargo theft.
- ISP: January–April 2026 the lowest violent-death count since 1991 ↗
The 1,242 figure and the 35-year comparison.
- July 2026: violent lethality up 25% after six months of decline ↗
The counterweight to the half-year trend, and why monthly data is volatile.
- FBSP yearbook: 72,187 phones robbed or stolen in Rio state in 2025 ↗
The +22.7% state rise against a 7.7% national fall, and the ~198-a-day figure.
- ISP: phone robbery as a share of street robbery, with Centro's growth ↗
The ~38% share and the Centro and Grande Tijuca breakdowns.
Keep planning
Rio safety map: 45 areas by day and night
The street-level resolution these citywide statistics cannot give you.
Is Rio safe right now?
The official same-day sources to check before you go out — planning context, not a live feed.
Scams in Rio de Janeiro
The non-violent side of the data: what furto and fraud actually look like in practice.
Robbed in Rio: what to do
Filing a boletim de ocorrência, cancelling cards, and the insurance paperwork.
Rio safety guide
The practical habits behind the numbers, neighbourhood by neighbourhood.